Food systems are complex, reporting shouldn't be
Tastefood facilitates food purchase categorization to determine emissions from food purchases. Please see the More Info tab which includes documentation for how the tool works. Two versions of the tool are currently available for use: one that categorizes purchases into the 18 Basic SIMAP categories and one that identifies plant-based foods as defined by AASHE STARS. A new version is under development soon and will be made available shortly. Each is accessible through the appropriate tab above.
Tastefood was developed by Rebecca Grekin, a graduate student at Stanford University in the Benson Lab in the Energy Science and Engineering department, as part of her Master’s work which can be found here!
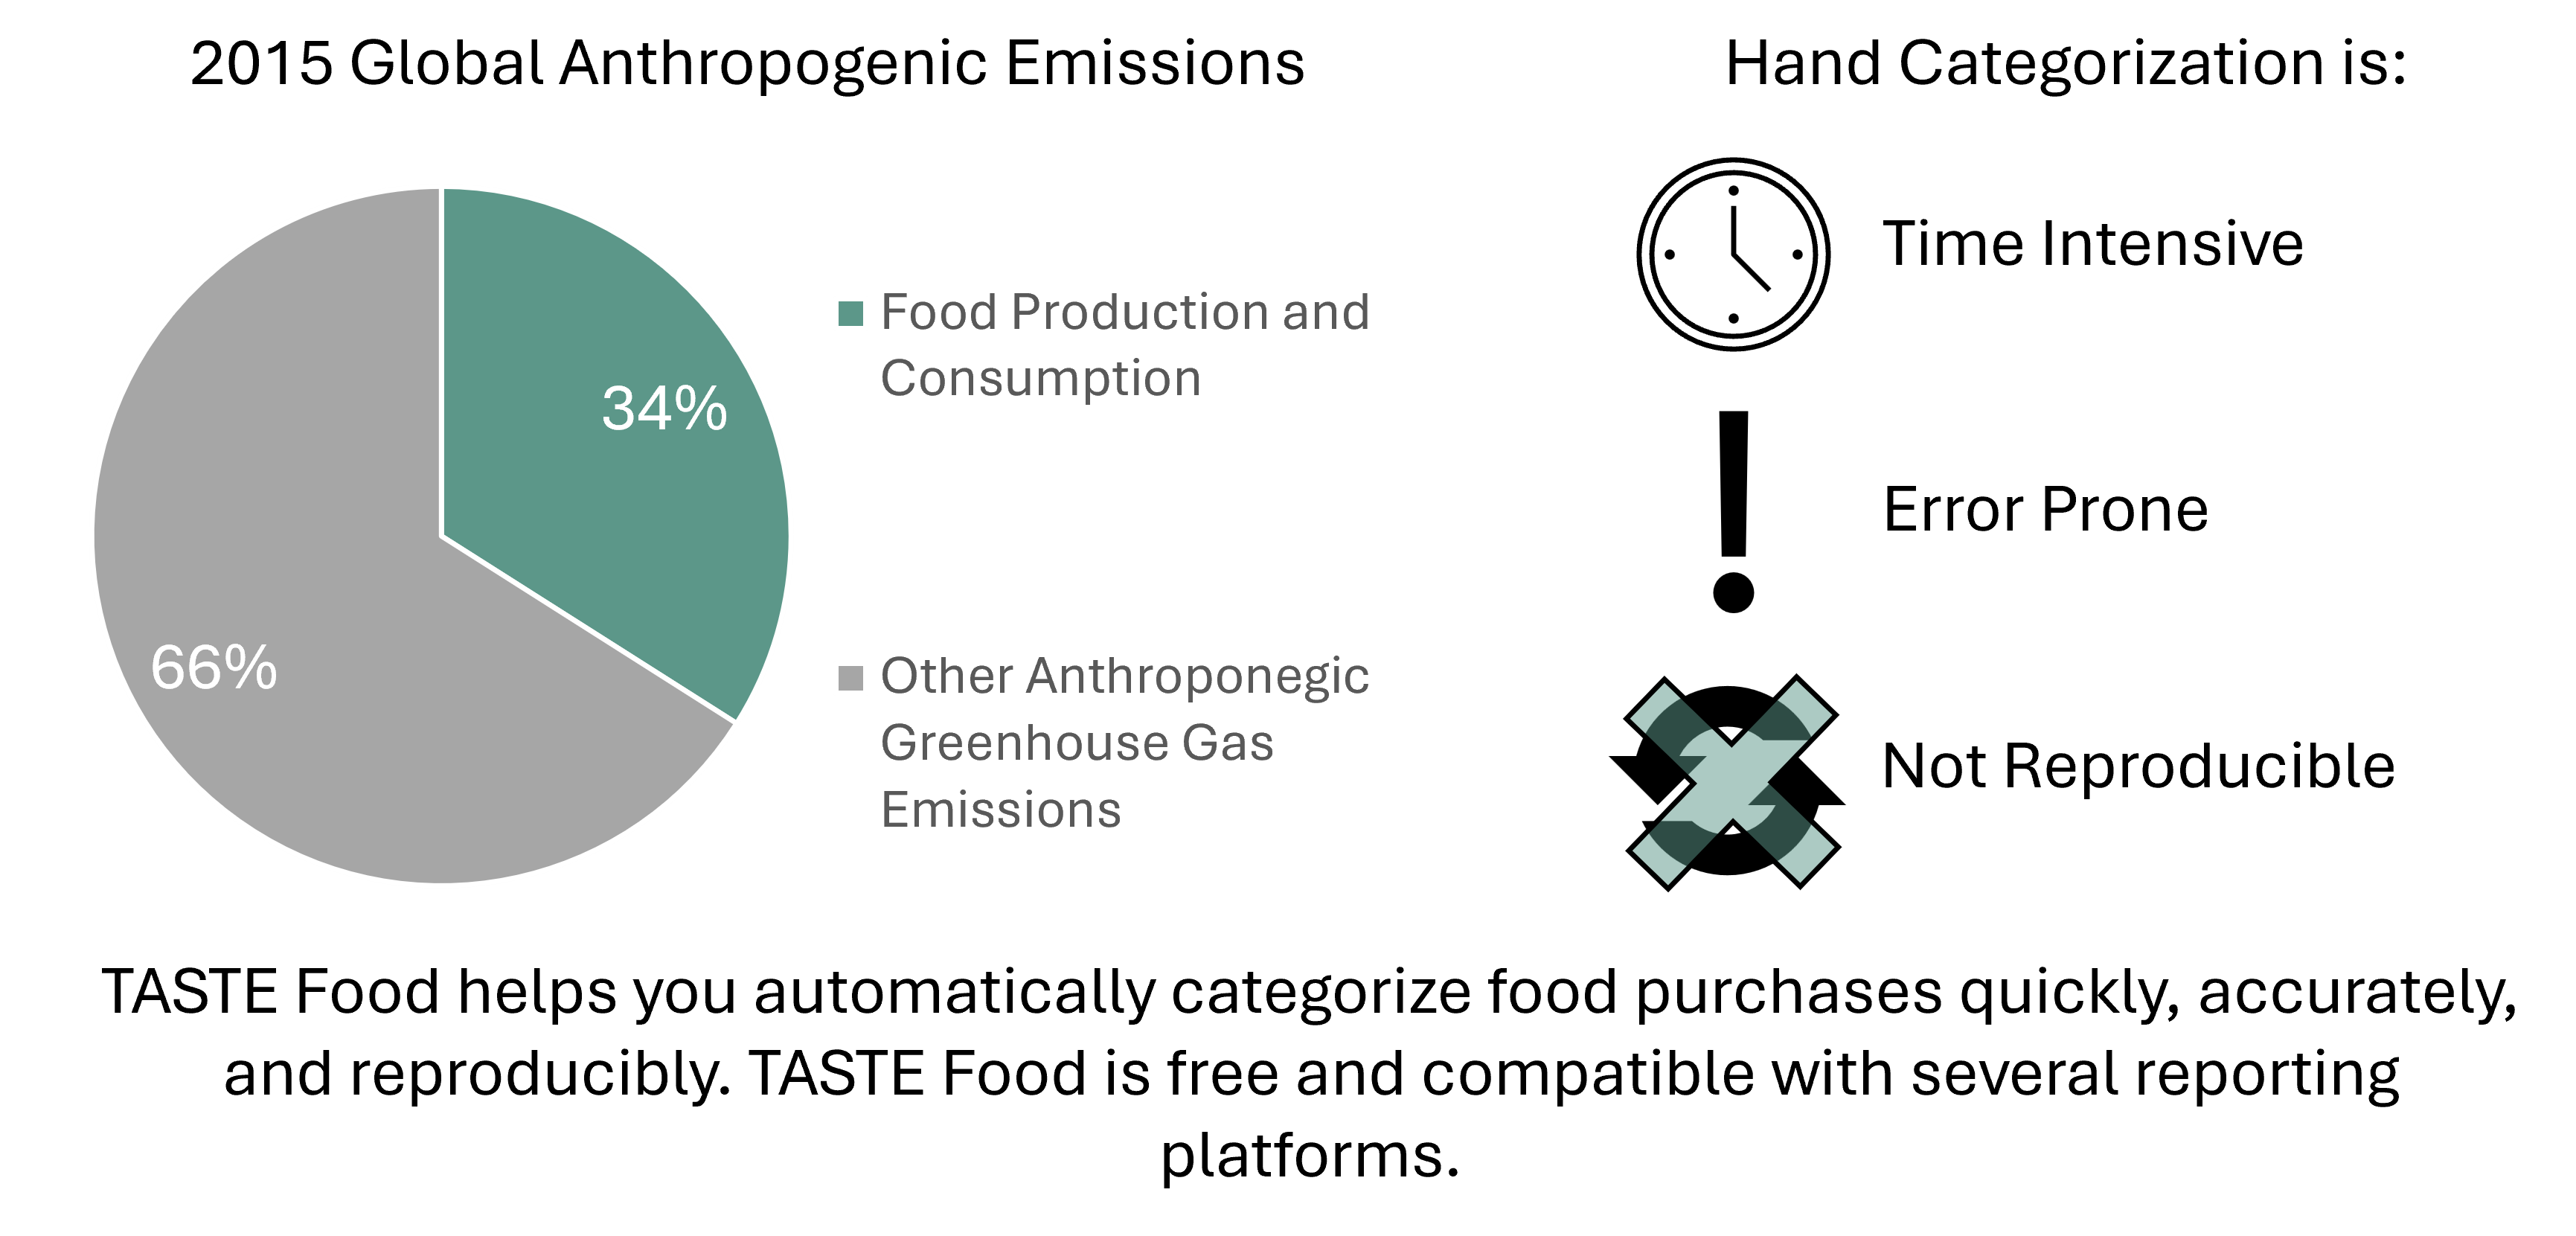
Before tastefood, estimating purchased food emissions required time intensive methods and cost prohibitive software which were often limited to estimating emissions based on spend. Previously, institutions that analyzed purchased food emissions underwent the slow and error-prone process of hand categorization. Due to the large amount of effort required by hand categorization, many institutions have been unable to prioritize quantifying and mitigating these emissions. Even for those institutions that have conducted hand categorizations, differences in how institutions categorize the same type of item, as well as high rates of human error, make it difficult to compare results between institutions. To improve this process, The Automated Scope 3 tool for Tracking Emissions from Food (Tastefood) was developed. By using Tastefood, institutions can quickly categorize food purchases, facilitating the process, and guaranteeing that the calculated emissions are determined consistently and can be compared from one institution to another.
This software is continually being improved and is being made available to users for free through this website. Feedback would be greatly appreciated. Please email with any questions and/or feedback.
Using Tastefood
1. Download the template from Templates Tab.
2. Format your data into the template.
3. Select the appropriate tab (SIMAP vs. STARS vs. Coolfood) above for the context that is relevant to you and your data.
4. Select the toggles that represent the analysis that you want to run (see the explanation document under More Info for details on these toggles)
5. Press submit. After pressing submit, the program will run. While running, the refresh icon in your browser will be an X instead of the usual arrow loop. Once it is finished, the final categorized file will be downloaded and emailed to the provided email address.
Please download the explanation document in the More Info tab for a more detailed explanation of the software, how to use this website, and the different sheets in the output file.
Testimonials
"Working with Rebecca and the Tastefood tool was invaluable for my research on the University Procurement for Planetary Health study, conducted in collaboration with the Menus of Change University Research Collaborative. Analyses of this scale can easily become overwhelming (a common barrier for large institutions like universities) but Rebecca’s support and the power of Tastefood made the process far more manageable. The tool saved countless hours of tedious work and freed me to focus on translating the findings into impact. As a result, we were able to clearly demonstrate the tremendous co-benefits of plant-forward procurement for advancing environmental sustainability, improving health, and strengthening institutions’ bottom lines. This work has inspired colleges, universities, and other organizations to continue driving plant-forward procurement forward."
– Jackie Bertoldo, DrPH, MPH, RDN Found & Principal, Eat Better by Design
"Tastefood has been an exceptionally helpful tool for carbon and nitrogen food footprint accounting at the University of Virginia. Implementing wide-spread use of the Tastefood tool has allowed our team to complete annual food data processing in a quarter of the time with repeatable, accurate results from year to year. We highly recommend Tastefood to anyone working to evaluate food sustainability metrics!"
– Libby Dukes, Sustainable Data Analyst, and Caroline Speidel,
Student Co-Chair for Nitrogen Working Group at University of Virginia
“Rebecca’s tool addresses several issues hampering those pursuing scope 3 accounting in higher education. Particularly impactful to this community is the tool’s reduction of manual work that discourages staff from starting their scope 3 footprints, as they are pressed for time and resources. She also makes a highly sophisticated tool accessible by using an interface friendly to all experience levels and staff functionalities. Additionally, her tool reduces human error by increasing consistency, which not only helps build higher-confidence footprints year-over-year, but also empowers individuals and institutions to compare data and footprints in a standardized way for benchmarking.”
– Annabelle Bardenheier, Stanford Scope 3 Emissions Analyst
“Having access to the Tastefood program has been transformative for our Housing & Dining Sustainability office at UC Berkeley. Not only has it streamlined complex reporting tasks like STARS and SIMAP, it has opened up new pathways to creatively leverage purchase order data for projects we couldn’t have imagined before. Just as importantly, it has given our student interns the opportunity to experiment, learn, and design projects directly tied to their passions and future careers. It’s made our work more impactful, more engaging, and frankly, more joyful. ”
– Shannen Casey, University of California Berkeley
Sustainability Program Manager
The Story of Tastefood
The Beginning
Rebecca's Master’s research project was focused on developing lessons learned from estimating scope 3 emissions associated with purchased goods. One main goal was to understand the impact of using various emissions factors on the estimated emissions from the same data set. Food was identified as the optimal subset of purchased goods to consider for analyzing the impact of using weight-based versus spend-based emissions factors. This is because it is commonplace to consider both the weight of food (e.g. 6 oz steak) and the spend associated with food (e.g. $50 steak) as compared to other purchase categories (e.g. it’s hard to visualize $50 worth of chair or 50 kg worth of chair).
To determine emissions from the purchased food from Stanford Dining Halls in 2019, Rebecca realized that it was necessary to categorize the purchased foods into categories for which emissions factors exist. Determined to not do this by hand, she began to develop software which would eventually turn into Tastefood. She realized that the need for fast, accurate, and replicable categorization of food purchases was not just unique to Stanford and this tool could be widely useful to many universities, and thus this website was born.
Tastefood may be helpful to an individual or institution in a variety of ways. If an institution hasn’t started looking at food emissions yet because of lack of guidance or manpower, Tastefood offers an opportunity to start looking at an institution's emissions from food purchasing with ease. If an institution has started looking at food purchasing emissions, but has been doing it by hand, Tastefood offers an opportunity to continue the good work in measuring food emissions, but now without the large time commitment necessary for hand categorization which can be dedicated to other sustainability projects. An institution may also be interested in comparing food purchasing emissions to other institutions. With hand categorizations, different institutions may categorize things differently, making estimated emissions comparisons difficult between institutions. Since Tastefood categorizes things the same across the board, the categorizations can be used to accurately compare among institutions. Finally, an institution may be interested in setting targets for their institution, and if this is the case, by using Tastefood, institutions can set reasonable and achievable targets for the future by understanding their starting point.
Validation and Partnerships
The SIMAP Basic version of Tastefood was validated using hand categorized data sets from 8 universities through a partnership with the SIMAP Nitrogen Working Group, and it was found that the tool-categorized data had emissions +/-5% the estimated hand categorized emissions.
The AASHE STARS version of Tastefood was conducted in partnership with The Association for the Advancement Sustainability in Higher Education (AASHE). Rebecca worked closely with the AASHE STARS team to develop the functionality to be able to accurately identify plant-based food items from a purchased foods data set and calculate the percentage of spend that is attributable to plant-based foods as well as organic foods.
A new partnership with the World Resources Institute (WRI) Coolfood pledge will now open the usefulness of Tastefood to more directly impact institutions outside of universities, significantly increasing the impact of Tastefood. Stay tuned for the new WRI Coolfood Pledge Version of Tastefood coming soon!
Today, more than 50 universities have used Tastefood which has effectively lowered the hurdle for universities and other institutions to begin looking at emissions associated with food purchasing. Tastefood has also allowed universities to start setting goals for emissions reductions.
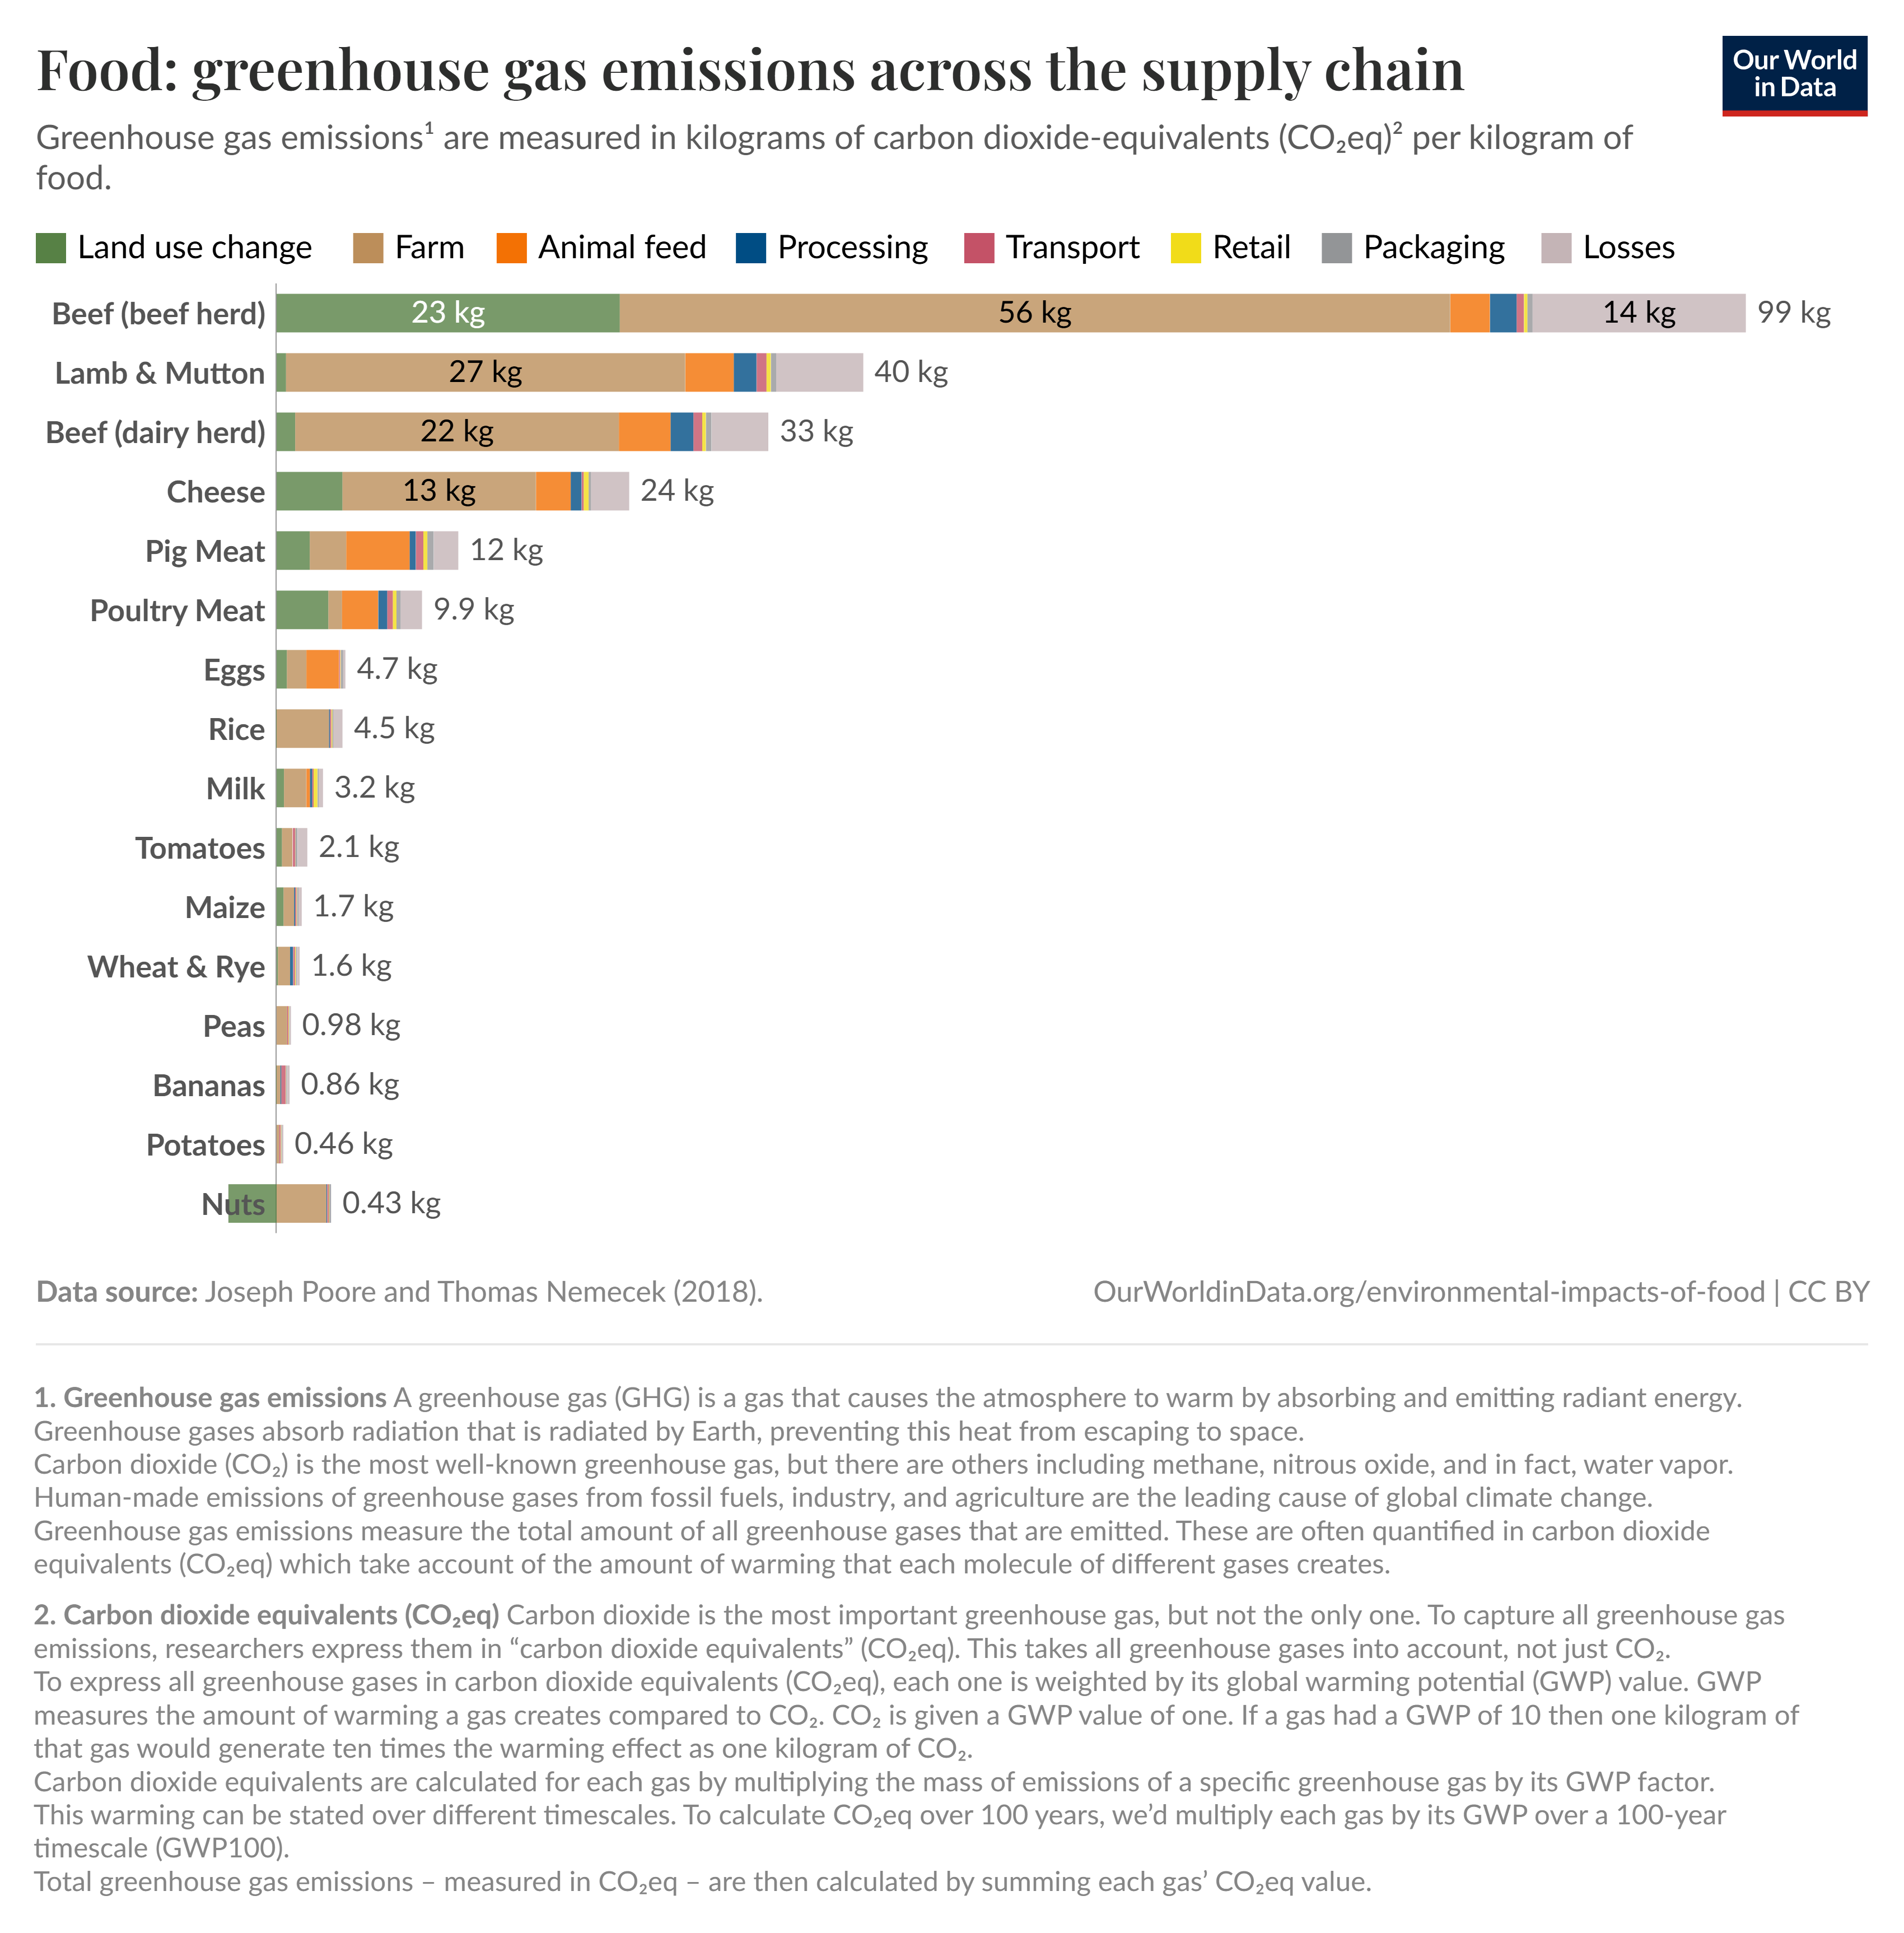
Why Food Purchasing Matters
Food was responsible for one third of global anthropogenic emissions in 2015. Food purchasing also represents a significant portion of a university's nitrogen footprint.
To ensure continued improvement, output files are monitored. All data is anonymized before any analyses are run. Please email if you would not like your data to be used for improvement of the tool or anonymized in future publications.
Last updated: 04/27/2026 6:00PM PST
Academic Software License: © 2022 Rebecca Grekin. Academic or nonprofit researchers are permitted to use this Software (as defined in attachment below) subject to Paragraphs 1-4
Summary
This tool was developed in partnership with SIMAP to categorize food purchases into the 18 basic categories as defined by SIMAP. The output of this tool can be used to directly upload into SIMAP. For more information please see the SIMAP Website. You will know the program is running because the refresh button at the top of your browser will be an X instead of the usual arrow loop.
A video tutorial is available on youtube which explains the basics of how to use Tastefood.
File Upload
Summary
This tool was developed in partnership with AASHE to identify plant-based food purchases for AASHE STARS Reporting. You will know the program is running because the refresh button at the top of your browser will be an X instead of the usual arrow loop.
File Upload
Coming Soon!
If you would like to help this version of Tastefood to become available more quickly, please fill out this form and I will be in touch.
The food template document below is the template that must be filled out and uploaded in the SIMAP Basic and/or STARS tabs in order for the tool to be able to categorize the data correctly. Title (Item Name) is the only required column. Fill out other columns based on your available data and categorization intended use. Download the guidelines document below for more information.
Please see below to download examples of the filled out input template and the outputs.
Please download the document below for a detailed explanation of how to use Tastefood, the website, and interpretation of the outputs.
Provided Inputs
If you are interested in looking at the key words document and edge cases document please download them below. These have been created using food purchasing data from 40+ universities and counting. They are constantly being amended and improved. If you have any comments, questions, or improvements that you would like to suggest, please email. The advanced inputs in the SIMAP Basic tab allows the user to upload of both of these documents to help account for idiosyncracies of data sets.
Video Tutorial
A video tutorial/walk through is available on youtube which explains the basics of how to use the website. Please feel free to watch the video here.Acknowledgements
I would like to thank many individuals and partnerships for their help in developing Tastefood. Without them, this tool would not be as good as it is today. In alphabetical order these are: Sally Benson, Mateus Bezrutchka, Isabel Kaspriskie, Allison Leach, the SIMAP Nitrogen Working Group Members, the Stanford University Office of Sustainability, and the Stanford University Residential and Dining Enterprises.
Donations
If you would like to donate to help maintain the server on which Tastefood runs, the recommended donation is of $0.05/1000 lines of data processed through the tool. You can donate here!
Q: What should I do with the items in the uncategorized entries in the output file?
A: There are a couple of options:
• Simply disregard this data. If the total weight or spend of the uncategorized items in this sheet is small compared to your entire data set, you can simply not include the data in your analysis
• You can hand categorize the items that are uncategorized and copy them from the uncategorized entries sheet to the main Categorized Data sheet. If you do this, you will also need to include the weight or spend information from those line items into the spend per category or weight per category tabs if you are using those.
• The leftmost column of the uncategorized entries sheet shows the row number of each data point in the original file fed into the tool. If an item was not tagged because it is misspelled or not enough information was able to be obtained from the original item name, you can go into your original file, find the line item and add an appropriate key word to the item name (for example, apple for red delicious, pretzel for snack mix) and re-run the file through Tastefood with the edited line item names. If this is done instead of the hand categorization of uncategorized items, then the spend per category and weight per category will include the weights and spend from the lines that had previously been uncategorized.
Q: What should I do with the items in the Vegan Unlabeled sheet in the output file?
A: This sheet includes both vegan and gluten-free items that Tastefood was not able to categorize because no brand information was included. There are many different ways vegan and gluten-free items can be made (such as with beans, veggies, nuts, etc) and thus without brand information, it is hard to categorize these items. They have been consolidated in this sheet to facilitate categorization by other means:• You can add brand information to the item names if those are available and re-run the previously uncategorized items through Tastefood.
• You can make an assumption about how the items in your data set are made and assign the vegan and gluten-free items to the appropriate categories by hand. You can hand categorize these items and copy them from the uncategorized entries sheet to the main Categorized Data sheet. If you do this, you will also need to include the weight or spend information from those line items into the spend per category or weight per category tabs if you are using those.
• Simply disregard this data. If the total weight or spend of the vegan or gluten-free items in this sheet is small compared to your entire data set, you can simply not include the data in your analysis
Q: Why is one (or more) of the totals for my weight or spend per category blank?
A: This means that there are some values in the data set you fed into the program where either the weight or spend is missing. Please either delete this line item if you do not know the spend or weight for this item, try to find the appropriate weight or spend from your original data source, or put a zero in that space if the missing data is not particularly important to the analysis you are planning to do after.Q: I only have spend, or I only have weight data. Can I still use the tool? Which columns are required?
A: Yes! You can leave either column empty and just make sure to not ask the tool to calculate the spend or weight per category if you do not have that data. Only the title column is required for categorization.Q: Why is, for example, Cereal or Donuts not being categorized to Sugars as well as to Grains? (Can replace any food with any other two categories)
A: The recommendation for categorization is that the weight or spend should be evenly split between the categories. Thus, if the categorization does not make up 50% of the weight for a two category item or 33.3% of the weight for a three category item, it should not be assigned to the additional categories. For example, often, people are confused why things such as cereal or donuts are not categorized as Sugars as well as Grains, and this is because both of those, although they are very sugary, are not 50% by weight sugar, therefore only Grains is assigned to this category.Q: Why is Category2 not in position 1?
A: There is no difference in assumptions made for the first or second or third category. Therefore, the order of the categories should not matter.Q: I believe an item should have been tagged as plant-based but it was not. Why?
A: The ASHEE STARS version of the tool aims to tag only items that are definitely plant-based. In order to do this, some items which are ambiguous or sometimes are and sometimes aren't plant-based are not tagged by the tool. Thus, the tool provides a lower-bound of the percentage of spend on plant-based items. If you submit the underlying data to AASHE STARS, someone from the AASHE STARS team will look over the underlying data and may be able to add additional items which should have been tagged. You are also welcome to edit the output yourself before inputting to AASHE STARS if you feel certain an item was incorrectly tagged as not plant-based when it should be plant-based. It is also important to know that food items that are predominantly composed of ingredients of neither plant/fungi nor animal origin that are not intended as alternatives to meat or dairy (e.g., packaged mineral water with fruit flavoring) do not qualify as plant-based. Therefore, things such as wine or vinegar, even though they do not contain animal products are not considered plant-based by AASHE STARS. This means that not all items that are vegan are considered plant-based but all plant-based items are vegan.Q: I am getting an internal server error page which says: "The server encountered an internal error and was unable to complete your request. Either the server is overloaded or there is an error in the application."
A: The tool is being hosted on an external server and, because of cost constraints, the server times out which is what causes the error you are seeing.There are a couple of ways to circumvent this:
• First, if you are not using a pivot table to consolidate all the items with the same name, you can do this in order to reduce the total number of items that the software has to look at (there is information on how to do this in the explanation document available on the More Info tab, but if you have any questions or difficulties with this I am also happy to help).
• Second, you may have a large number of non-food items included in your data set. These can include gloves, utensils, hair nets, and other commonly purchased items for dining halls that are not food. Please remove these and the probability of seeing the error should decrease.
• Third, you can split up the file into a couple of files and run each one through the tool. It should be able to handle ~10000 lines without running into this time out issue as long as there aren’t a significant number of items the tool cannot categorize
• Fourth, you are welcome to send me the file, and I can run it locally on my laptop and then there is no time out issue.
Have another question? Please email me, and I will respond as soon as possible!